Oh no opentelemetry! Memory leaks in instrumenting Sqlalchemy
6/25/2023
On Wednesday last week around midday PST, I deployed an application to production and went to lunch. A few hours later, a seemingly unrelated request for help came through the help channel: “We can’t reach our Postgresql server! It says ‘max connections reached!‘”
Well, that sounded like a problem! Realizing from the “active connections” graph that the database server was maxed out and that it had taken a few hours to reach its max active connections, I figured the first easiest thing to do was restart the server so it would drop all connections and allow apps to connect again. This move bought me a few hours to figure out the source of the problem and relieved pressure on the failing applications that needed to connect. I also added an alert to the server, a useful notification that had been sadly overlooked, to let us know if the max active connections climbed too high again.
With those chores completed, apps were connecting to the server again and I had about three hours before the problem went critical again, so I started looking at the problem more deeply. At first I didn’t connect the climbing connections to my deployment earlier in the day: all I’d done was add Opentelemetry to a Python application! Oddly, though, the database connections began increasing linearly within a few minutes of my release whereas in the previous 30 days they’d consistently fluctuated between 15%-30% of max.
To test whether my release was related to this problem, I started rolling parts of the deployment. When I got to the Celery workers, the active connections graph rocketed straight down and then started climbing linearly again, so I’d found the prime suspect! Armed with this knowledge, I rolled back my release and went to work identifying the cause.
The Opentelemetry Project
As mentioned above, my release had added Opentelemetry to this application, and this somehow had the unfortunate effect of causing database connections to increase until the server ran out, an issue that had not appeared in our Dev or Stg environments. It’s a partial relief to hone in on an issue and have a fix that buys as much time as you need, but in this case the relief of resolving the issue was deflated by the mystery of how this seemingly unrelated software change could possibly cause such a problem. This mystery was compounded by half a dozen people looking at the diff for the release and saying, “All we did was add Open Telemetry! We’ve added it to over a dozen projects!”
Now, the Opentelemetry project allows us to add identifying marks around chunks of processing in an application. It provides a boon of highly detailed information about what’s happening in our software, allowing us to more easily identify lag or errors. There are many great ideas in Opentelemetry, but two I find particularly inspired. First, there’s the insight that we can add identifiers to different transactions in our applications (called “spans”) and to requests between applications. With the “parent” attribute on a span, we can link processing across disparate services and chart it in a single place.
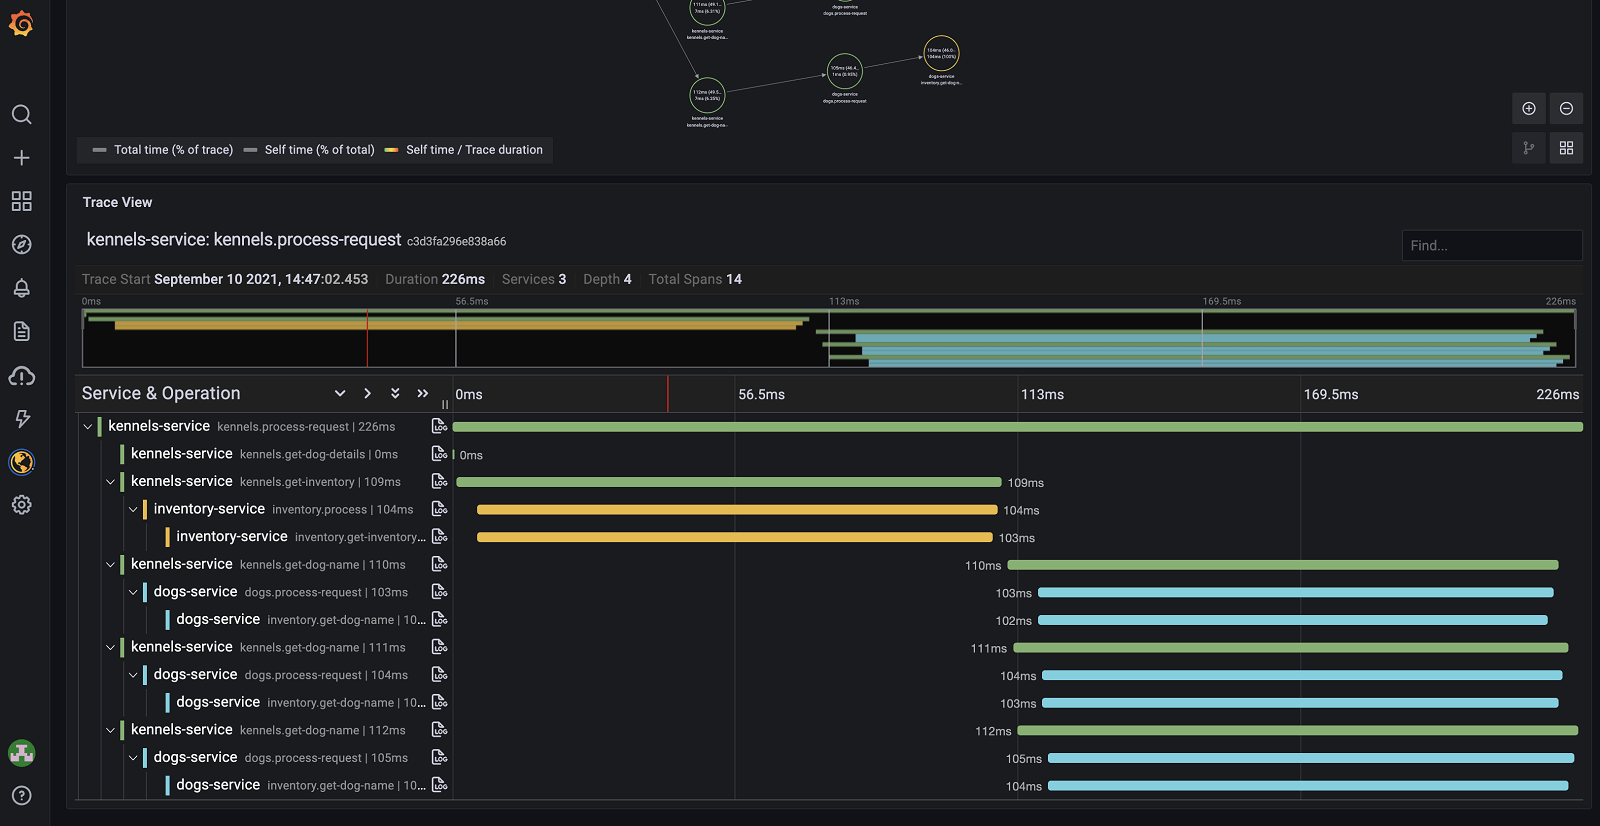
The second idea is an awareness that this work would involve invasive application-code changes, so the Opentelemetry team has offered libraries that will automatically “instrument” code: with a few lines of code bootstrapping instrumentation, almost everything in an application will report what it’s doing and how long it takes to do so. Further, downstream chunks of IO or processing in other services, if also instrumented, will be part of a single hierarchy of tracing spans and their parents: no custom configuration is required. It sounds too good to be true! In reality, it works brilliantly and results in amazingly detailed waterfall graphs like this one:
How to Implement
Using code from the Opentelemetry project, we can automatically instrument a huge number of Python libraries, from web frameworks to HTTP clients to database libraries. For the project I worked on, adding Opentelemetry meant:
- Configuring the app to “export” its tracing spans to an Opentelemetry collector, and
- Instrumenting the application
For the latter, I added a few lines of code like the following:
from opentelemetry.instrumentation.flask import FlaskInstrumentor
from opentelemetry.instrumentation.requests import RequestsInstrumentor
from opentelemetry.instrumentation.sqlalchemy import SQLAlchemyInstrumentor

FlaskInstrumentor().instrument()
RequestsInstrumentor().instrument()
SQLAlchemyInstrumentor().instrument()
It’s pretty easy!
Under the covers, “Instrumenting” usually means adding the equivalent of detailed log messages with trace IDs to the libraries we’re running. While exporting traces involves talking to a server, instrumenting shouldn’t result in any IO. For instance, the SQLAlchemyInstrumentor will wrap a Sqlachemy Engine with some code that adds comments to SQL queries. Here’s a truncated example from their codebase:
from wrapt import wrap_function_wrapper as _w

class SQLAlchemyInstrumentor(BaseInstrumentor):
    """An instrumentor for SQLAlchemy
    See `BaseInstrumentor`
    """

    def _instrument(self, **kwargs):
        _w(
            "sqlalchemy",
            "create_engine",
            _wrap_create_engine(tracer, connections_usage, enable_commenter),
        )
The function _wrap_create_engine called above is a decorator that swaps the engine that typically results from sqlalchemy.create_engine() with something called an EngineTracer:
def _wrap_create_engine(tracer, connections_usage, enable_commenter=False):
    def _wrap_create_engine_internal(func, _module, args, kwargs):
        """Trace the SQLAlchemy engine, creating an `EngineTracer`
        object that will listen to SQLAlchemy events.
        """
        engine = func(*args, **kwargs)
        EngineTracer(tracer, engine, connections_usage, enable_commenter)
        return engine

    return _wrap_create_engine_internal
This shouldn’t create more database connections than the app would otherwise want, especially if these EngineTracer objects aren’t sticking around longer than they should, so what’s going on here?
Because I was adding Opentelemetry to this application, I hadn’t read too deeply into the codebase, but after doing some digging, I discovered that elsewhere in the codebase there were some Celery worker functions that looked roughly looks like this:
import pandas as pd
from sqlalchemy import create_engine

class PredictionMaker:
    def __init__(self, some_key: str):
        self.some_key = some_key

    def load_data(self):
        ...
        self.db_engine = create_engine(db_connection_string)
        ...

    def load_other_data(self):
        return pd.read_sql(
            'SELECT int_column, date_column FROM test_data',
            self.db_engine
        )

@celery.task
def some_task():
    predictor = PredictionMaker()
    predictor.load_data()
    predictor.load_other_data()
From this, we can see that create_engine is called at least once on each function invocation. Okay, I have to admit, when I see self.db_engine = create_engine(...) I feel the same way a bloodhound must feel when it picks up a faint scent on the forest floor. create_engine by default creates a database connection pool with 5 connections and will even overflow up to 20 if necessary. I have worked as a software developer and as an SRE and so I’m really cautious about creating connection pools because I’ve had to support databases and keep them healthy! Thus, there’s something extremely fishy to me about creating a connection pool and stashing it on an instance of class: a database connection pool should be created once, application-wide. Further, in this bug we’re creating a massive number of database connections, so what if these self.db_engine references are not being garbage-collected after the Celery function runs and all variables inside go out of scope? They should be garbage-collected if the EngineTracer objects (which stand-in for Engines) get garbaged-collected, but it certainly looks like they aren’t!
Memory Leaking Database Engines
It turns out that’s what’s happening. If you recall the SQLAlchemyInstrumentor.instrument() method above, it listens for all create_engine calls and monkeypatches the resulting value with an EngineTracer. These objects are then stashed inside a list in order to run some cleanup code when they go out of scope.
Python’s garbage-collector relies on references to objects. Once an object has zero references (no other object points to it in memory), then it will be marked for deletion and in one more generations (passes, really) the object will get deleted. By contrast, a memory leak is when references to objects are obscured somehow and as more objects get created they are eventually abandoned and the application cannot recover memory allocated to it. In Python if there are any references to a created object, it can’t be garbage-collected and according to an issue where this was reported for the SQLAlchemyInstrumentor, that’s what’s happening in this library!
The solution? Turn all Engine references to weak references in order to allow them to be garbage-collected, and this is exactly what the associated pull request does.
Tags: python,Opentelemetry,Sqlalchemy